PHP生成图表pChart的示例解析
吾爱主题
阅读:171
2021-10-21 12:30:00
评论:0

pchart是一个开源的图表生成库,主要涉及3个class:pchart.class, pdata.class, pcache.class,可生成20多种简单或复杂的图表,支持png,jpg,gif通用图片格式。数据源可以来自于database,csv,当然也可以手写。使用该程序php需要开启gd服务,先来看看pchart的工作流程:
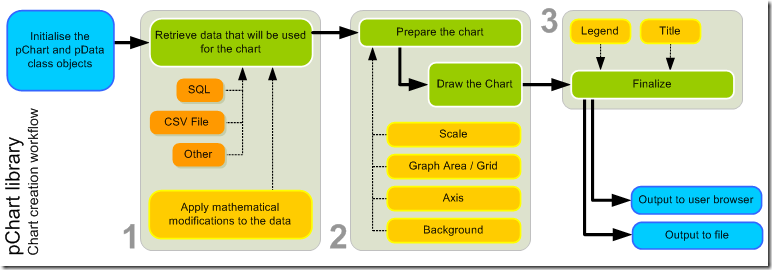
主要分为三步:
- * 读取用于生成图表数据(数据库、文件)
- * 设计图表样式(圆角、底色等)
- * 制作标签、题目、图例并生成图表
下面看一个简单的柱状图表:
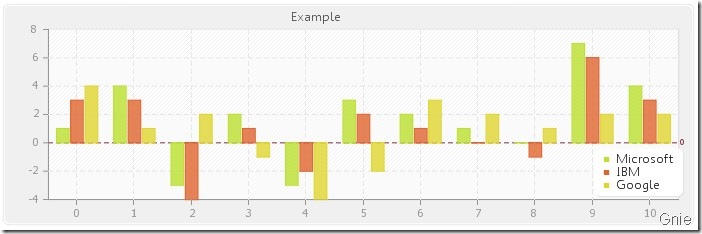
代码如下:
?| 1 2 3 4 5 6 7 8 9 10 11 12 13 14 15 16 17 18 19 20 21 22 23 24 25 26 27 28 29 30 31 32 33 34 35 36 37 38 39 40 41 42 43 44 45 46 47 48 49 50 | <?php // standard inclusions include ( "pchart/pdata.class" ); include ( "pchart/pchart.class" ); // dataset definition $dataset = new pdata; //图表数据 $dataset ->addpoint( array (1,4,-3,2,-3,3,2,1,0,7,4), "serie1" ); $dataset ->addpoint( array (3,3,-4,1,-2,2,1,0,-1,6,3), "serie2" ); $dataset ->addpoint( array (4,1,2,-1,-4,-2,3,2,1,2,2), "serie3" ); $dataset ->addallseries(); $dataset ->setabsciselabelserie(); //数据图例 $dataset ->setseriename( "microsoft" , "serie1" ); $dataset ->setseriename( "ibm" , "serie2" ); $dataset ->setseriename( "google" , "serie3" ); // initialise the graph $test = new pchart(700,230); //设置图表尺寸、样式 $test ->setfontproperties( "fonts/tahoma.ttf" ,8); $test ->setgrapharea(50,30,680,200); $test ->drawfilledroundedrectangle(7,7,693,223,5,240,240,240); $test ->drawroundedrectangle(5,5,695,225,5,230,230,230); $test ->drawgrapharea(255,255,255,true); $test ->drawscale( $dataset ->getdata(), $dataset ->getdatadescription(),scale_normal,150,150,150,true,0,2,true); $test ->drawgrid(4,true,230,230,230,50); // draw the 0 line $test ->setfontproperties( "fonts/manksans.ttf" ,6); $test ->drawtreshold(0,143,55,72,true,true); // draw the bar graph //柱状图要使用drawbargraph() $test ->drawbargraph( $dataset ->getdata(), $dataset ->getdatadescription(),true,80); // finish the graph //制作图例、标题、字体等属性 $test ->setfontproperties( "fonts/manksans.ttf" ,10); $test ->drawlegend(596,150, $dataset ->getdatadescription(),255,255,255); $test ->setfontproperties( "fonts/manksans.ttf" ,10); $test ->drawtitle(50,22, "example" ,50,50,50,585); //生成图表 $imagefile = "example12.png" ; $test ->render( $imagefile ); echo '<img src="' . $imagefile . '">' ; ?> |
这个是雷达效果的:

代码:
?| 1 2 3 4 5 6 7 8 9 10 11 12 13 14 15 16 17 18 19 20 21 22 23 24 25 26 27 28 29 30 31 32 33 34 35 36 37 38 39 40 41 | <?php // standard inclusions include ( "pchart/pdata.class" ); include ( "pchart/pchart.class" ); // dataset definition $dataset = new pdata; $dataset ->addpoint( array ( "memory" , "disk" , "network" , "slots" , "cpu" ), "label" ); $dataset ->addpoint( array (6,4,7,4,5), "serie1" ); $dataset ->addpoint( array (2,3,5,2,4), "serie2" ); $dataset ->addserie( "serie1" ); $dataset ->addserie( "serie2" ); $dataset ->setabsciselabelserie( "label" ); $dataset ->setseriename( "reference" , "serie1" ); $dataset ->setseriename( "tested computer" , "serie2" ); // initialise the graph $test = new pchart(400,400); $test ->setfontproperties( "fonts/tahoma.ttf" ,8); $test ->drawfilledroundedrectangle(7,7,393,393,5,240,240,240); $test ->drawroundedrectangle(5,5,395,395,5,230,230,230); $test ->setgrapharea(30,30,370,370); $test ->drawfilledroundedrectangle(30,30,370,370,5,255,255,255); $test ->drawroundedrectangle(30,30,370,370,5,220,220,220); // draw the radar graph //要使用drawradaraxis()生成雷达效果 $test ->drawradaraxis( $dataset ->getdata(), $dataset ->getdatadescription(),true,20,120,120,120,230,230,230); $test ->drawfilledradar( $dataset ->getdata(), $dataset ->getdatadescription(),50,20); // finish the graph $test ->drawlegend(15,15, $dataset ->getdatadescription(),255,255,255); $test ->setfontproperties( "fonts/tahoma.ttf" ,10); $test ->drawtitle(0,22, "example" ,50,50,50,400); $imagefile = "example8.png" ; $test ->render( $imagefile ); echo '<img src="' . $imagefile . '">' ; ?> |
再看几个其他的效果
1,饼图:

2, 双座标曲线图:

3, 层叠柱状图:

4, 多图表:

图表的种类已经相当丰富了,具体图表设置请参考
http://pchart.sourceforge.net/documentation.php?topic=pchart
到此这篇关于php生成图表pchart的示例解析的文章就介绍到这了,更多相关php生成图表pchart内容请搜索服务器之家以前的文章或继续浏览下面的相关文章希望大家以后多多支持服务器之家!
原文链接:https://www.cnblogs.com/gnielee/archive/2009/08/06/1540367.html
声明
1.本站遵循行业规范,任何转载的稿件都会明确标注作者和来源;2.本站的原创文章,请转载时务必注明文章作者和来源,不尊重原创的行为我们将追究责任;3.作者投稿可能会经我们编辑修改或补充。